CSStripChart QML Type
Display a strip chart. More...
| Import Statement: | import CSDataQuick.Components 1.0 |
| Inherits: |
Properties
- legendVisible : bool
- model : var
- period : int
- title : string
- units : int
- xLabel : string
- yLabel : string
Detailed Description
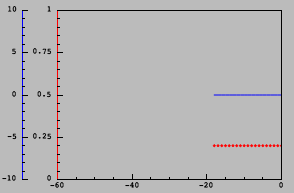
A strip chart acquires the data and updates the plot in fixed period. period and units together define the time span.
CSStripChart {
    model: ListModel {
        ListElement {
            channel: 'catest'
            color: 'red'
        }
        ListElement {
            channel: 'catest2'
            color: 'blue'
        }
    }
}
Property Documentation
model : var |
This property holds the data list model.
The model can be ListModel or JSON object array. In any case, each element contains the following properties,
- channel - the data source to monitor.
- label - the descriptive text.
- color - the color of the line for that channel,
- loprSrc - the lower range source.
- loprDefault - the default lower range.
- hoprSrc - the upper range source.
- hoprDefault - the default upper range.
Note: Only in the form of JSON object array, it can be used in Qt Quick Designer
This property holds the time axis units.
- TimeUnit.MilliSecond
- TimeUnit.Second
- TimeUnit.Minute