CSCartesianPlot QML Type
Display XY Plot. More...
| Import Statement: | import CSDataQuick.Components 1.0 |
| Inherits: |
Properties
- count : int
- countSource : string
- eraseMode : int
- eraseOldest : bool
- eraseSource : string
- legendVisible : bool
- model : var
- plotStyle : int
- title : string
- triggerSource : string
- xLabel : string
- yLabel : string
Detailed Description
A Cartesian Plot consists of an X and one or two Y axes on which data can be plotted. The sets of data are called traces and consist of a set of (x, y) pairs, a color, and a Y axis indicator. The traces correspond to curves on the plot.
Currently there can be up to eight traces on a plot. The first trace is plotted on the Y1 axis, and the remaining traces (if any) are all plotted on the Y2 axis. But the Y axis, Y or Y2, can be selected for each trace. The X and Y1 axes may have a label, but the Y2 axis does not. Each trace can (but does not have to) have a CSData from which to get the x values and another from which to get the y values. These CSData can be of array type, such as Waveforms record in EPICS, or they can be of scalar type with only a single value.
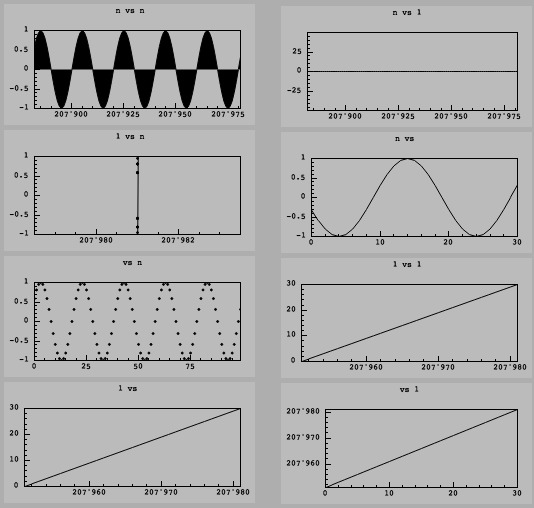
There are eight possible kinds of traces as seen in the following table. The traces for a given plot do not all have to be of the same kind – they can be mixed.
In the table Nx is the number of elements in the CSData specified for x, and Ny is the number of elements in the CSData specified for y. The letter n denotes a number greater than one, and a blank indicates no CSData is specified. The axis limits LOPR and HOPR denote the limits obtained from CSData. Typically, these are the fields LOPR and HOPR in the associated record. Count is the specified Count for the Cartesian Plot, which is described in more detail below.
| Nx | Ny | Type | Points |
|---|---|---|---|
| n | n | X Vector, Y Vector | x(i), y(i) |
| n | 1 | X Vector, Y Scalar | x(i), y |
| 1 | n | X Scalar, Y Vector | x, y(i) |
| n | X Vector | x(i), i | |
| n | Y Vector | i, y(i) | |
| 1 | 1 | X Scalar, Y Scalar | x, y |
| 1 | X Scalar | x, i | |
| 1 | Y Scalar | i, y |
Mouse interactions include,
| Click | Select the trace for zooming/panning. |
| Double Click | Reset the zoom |
| Wheel | Zoom the selected trace's axes. If the mouse hovers over a certain axis, only that axis gets zoomed. |
| Drag | Pan view of the selected trace. |
Property Documentation
- false: Plot n points corresponding to the first n changes of the data, then do not plot any more points.
- true: Plot n points corresponding to the last n changes of the data, overwriting previous points.
model : var |
Trace list model.
The model can be ListModel or JSON object array. In any case, each element contains the following properties,
- label - trace label
- xchannel - data source for x
- ychannel - data source for y
- color - line color
Note: Only in the form of JSON object array, it can be used in Qt Quick Designer
- 0: Plot the data as points.
- 1: Plot the data as lines.
- 2: Plot the data as lines which are filled under (or over) from the line to the axis.
Source of the trigger. If configured, whenever the value of the trigger data changes, the entire plot will be updated.